Just Tech Me At
Activision Blizzard, Inc.
Symbol: ATVI
2022
Financial Profile of
Activision
(March 10, 2023)
Summary
Activision Blizzard, Inc., together with its subsidiaries, develops and publishes interactive entertainment content and services in the Americas, Europe, the Middle East, Africa, and the Asia Pacific. The company operates through three segments: Activision, Blizzard, and King. It develops and distributes content and services on video game consoles, personal computers, and mobile devices, including subscription, full-game, and in-game sales, as well as by licensing software to third-party or related-party companies that distribute Activision and Blizzard products. The company also maintains a proprietary online gaming service, Battle.net that facilitates digital distribution of content, online social connectivity, and the creation of user-generated content. In addition, it operates esports leagues and offer digital advertising content; and provides warehousing, logistics, and sales distribution services to third-party publishers of interactive entertainment software, as well as manufacturers of interactive entertainment hardware products. The company's key product franchises include Call of Duty, World of Warcraft, Diablo, Hearthstone, Overwatch, Overwatch League, and Candy Crush. It serves retailers and distributors, including mass-market retailers, consumer electronics stores, discount warehouses, and game specialty stores through third-party distribution and licensing arrangements. The company is headquartered in Santa Monica, California.
Sector: Communication Services
Industry: Electronic Gaming & Multimedia
Full-Time Employees: 13000
Contact
2701 Olympic Boulevard Building B
Santa Monica, CA 90404
United States
310 255 2000
website- https://www.activisionblizzard.com
Quarterly
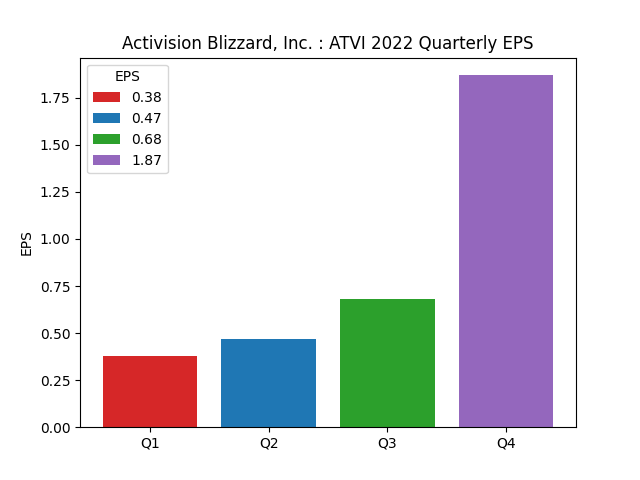
Earning Per Share
| Period | Earnings Per Share |
|---|---|
| 1Q2022 | 0.38 |
| 2Q2022 | 0.47 |
| 3Q2022 | 0.68 |
| 4Q2022 | 1.87 |
Quarterly
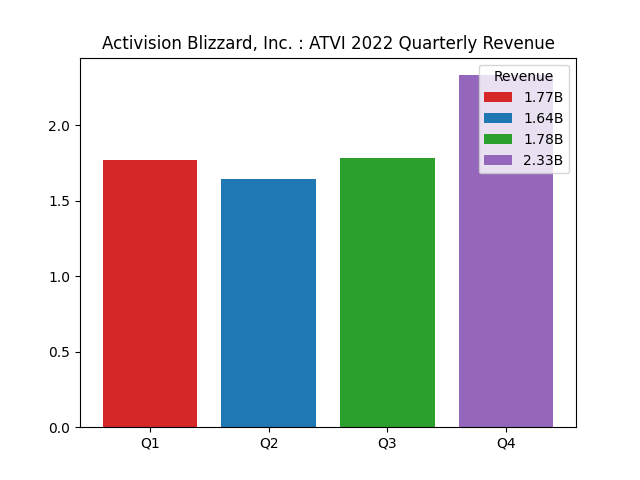
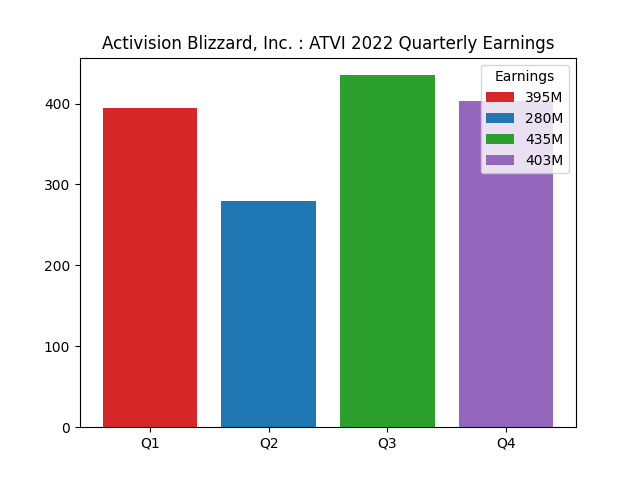
Revenue and Earning
| Period | |||
|---|---|---|---|
| 1Q2022 | |||
| revenue | 1.77B | ||
| earnings | 395M | ||
| 2Q2022 | |||
| revenue | 1.64B | ||
| earnings | 280M | ||
| 3Q2022 | |||
| revenue | 1.78B | ||
| earnings | 435M | ||
| 4Q2022 | |||
| revenue | 2.33B | ||
| earnings | 403M |
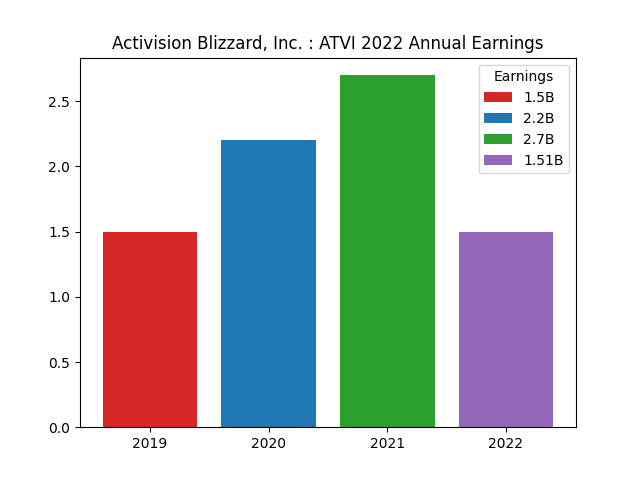
Annual
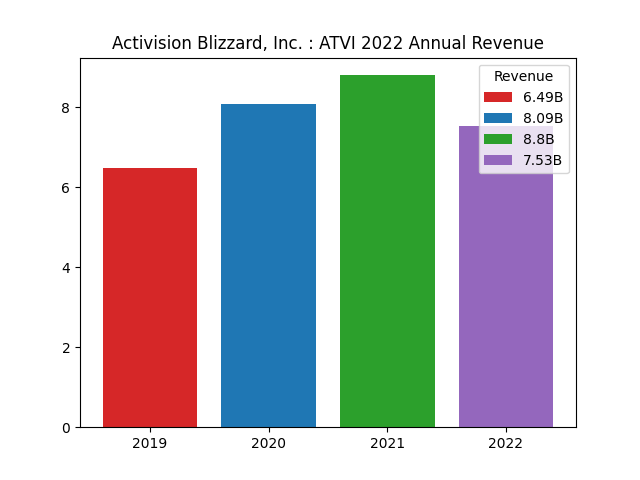
Revenue and Earning
| Period | |||
|---|---|---|---|
| 2019 | |||
| revenue | 6.49B | ||
| earnings | 1.5B | ||
| 2020 | |||
| revenue | 8.09B | ||
| earnings | 2.2B | ||
| 2021 | |||
| revenue | 8.8B | ||
| earnings | 2.7B | ||
| 2022 | |||
| revenue | 7.53B | ||
| earnings | 1.51B |
Financial Analysis Data
| Assessment | Value |
|---|---|
| ebitda margins | 23.55% |
| profit margins | 20.10% |
| gross margins | 70.48% |
| operating cash flow | 2.22B |
| revenue growth | 7.90% |
| operating margins | 22.14% |
| ebitda | 1.77B |
| gross profits | 5.31B |
| free cash flow | 2.33B |
| earnings growth | -29.30% |
| current ratio | 4.07 |
| return on assets | 3.97% |
| debt to equity | 20.04 |
| return on equity | 8.21% |
| total cash | 12.04B |
| total debt | 3.86B |
| total revenue | 7.53B |
| total cash per share | 15.35 |
| revenue per share | 9.63 |
| quick ratio | 3.73 |
Data Source: RapidAPI Yahoo Finance
Charts: Python generated charts provided courtesy of JustTechMeAt.