Just Tech Me At
Atlassian Corporation
Symbol: TEAM
2022
Financial Profile of
Atlassian
(March 14, 2023)
Summary
Atlassian Corporation, through its subsidiaries, designs, develops, licenses, and maintains various software products worldwide. Its products include Jira Software and Jira Work Management, a workflow management system for teams to plan, track, collaborate, and manage work, and projects; Jira Service Management, a service desk product for creating and managing service experiences for various service team providers, including IT, legal, and HR teams; Jira Align for enterprise organizations to build and manage a master plan that maps strategic projects to the various work streams required to deliver them; and Opsgenie, an incident management tool that enables IT teams to plan for and respond to service disruptions. The company also provides Confluence, a social and flexible content collaboration platform used to create, share, organize, and discuss projects; and Trello, a collaboration and organization product that captures and adds structure to fluid, fast-forming work for teams. In addition, it offers Bitbucket, a code management and collaboration product for teams using distributed version control systems; Atlassian Access, an enterprise-wide product for enhanced security and centralized administration that works across every Atlassian cloud product used, including Jira, Jira Service Management, Confluence, Trello, and Bitbucket; and various other products, such as Atlassian cloud apps, Bamboo, Crowd, Crucible, Fisheye, Halp, Sourcetree, and Statuspage. Atlassian Corporation was founded in 2002 and is headquartered in Sydney, Australia.
Sector: Technology
Industry: Software-Application
Full-Time Employees: 8813
Contact
Level 6, 341 George Street,
Sydney, NSW 2000
Australia
61 2 9262 1443
website- https://www.atlassian.com
Quarterly
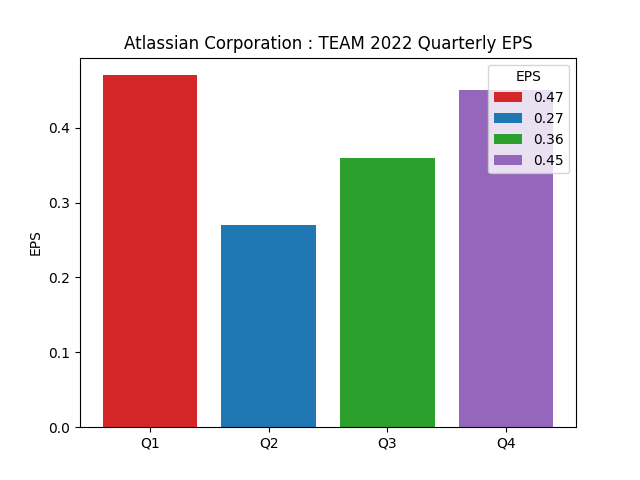
Earning Per Share
| Period | Earnings Per Share |
|---|---|
| 1Q2022 | 0.47 |
| 2Q2022 | 0.27 |
| 3Q2022 | 0.36 |
| 4Q2022 | 0.45 |
Quarterly
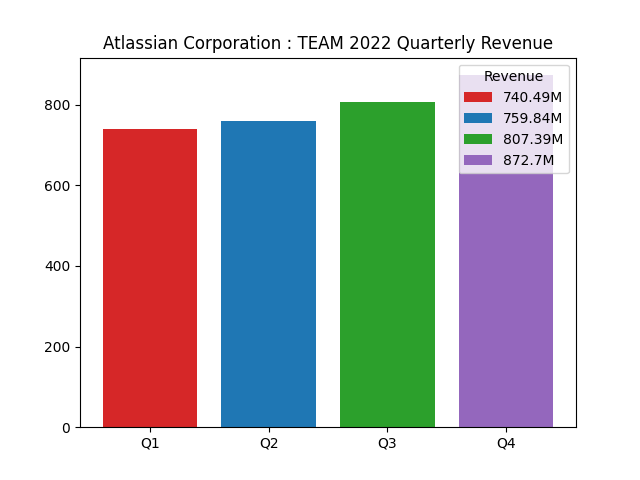
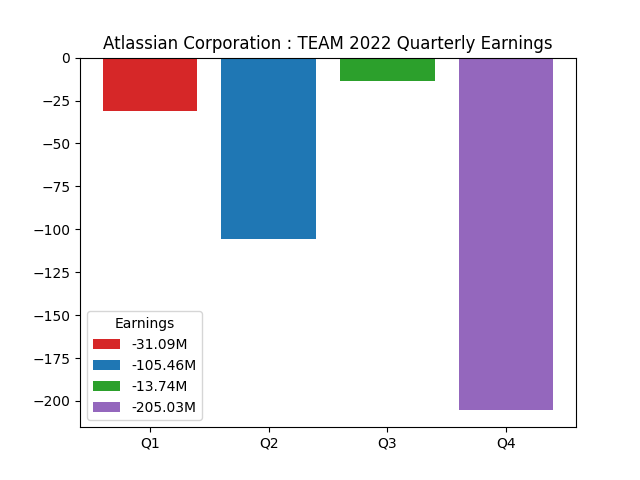
Revenue and Earning
| Period | |||
|---|---|---|---|
| 1Q2022 | |||
| revenue | 740.49M | ||
| earnings | -31.09M | ||
| 2Q2022 | |||
| revenue | 759.84M | ||
| earnings | -105.46M | ||
| 3Q2022 | |||
| revenue | 807.39M | ||
| earnings | -13.74M | ||
| 4Q2022 | |||
| revenue | 872.7M | ||
| earnings | -205.03M |
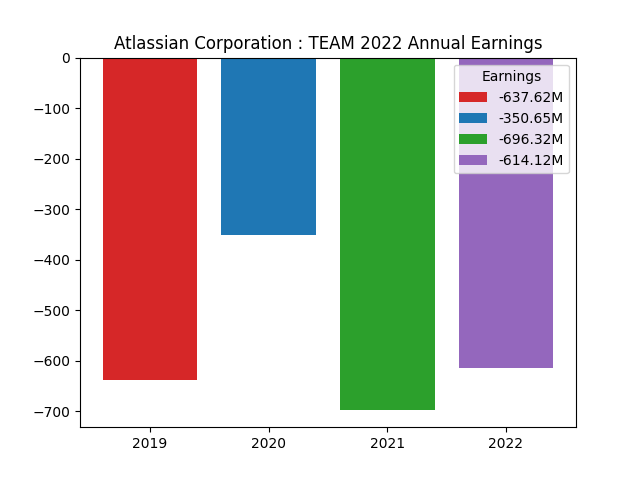
Annual
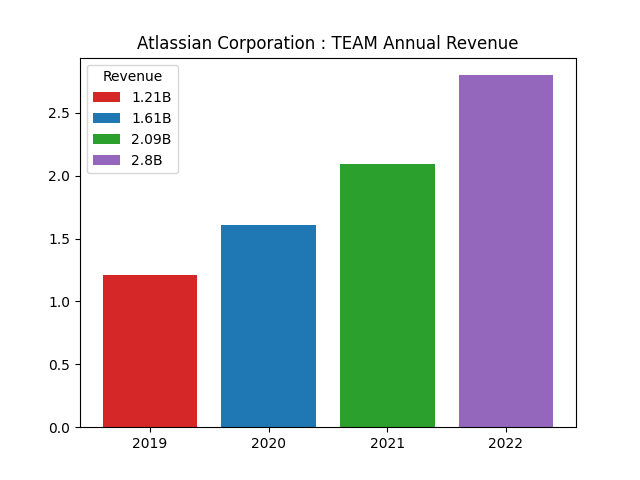
Revenue and Earning
| Period | |||
|---|---|---|---|
| 2019 | |||
| revenue | 1.21B | ||
| earnings | -637.62M | ||
| 2020 | |||
| revenue | 1.61B | ||
| earnings | -350.65M | ||
| 2021 | |||
| revenue | 2.09B | ||
| earnings | -696.32M | ||
| 2022 | |||
| revenue | 2.8B | ||
| earnings | -614.12M |
Financial Analysis Data
| Assessment | Value |
|---|---|
| ebitda margins | -8.99% |
| profit margins | -12.56% |
| gross margins | 82.56% |
| operating cash flow | 855.01M |
| revenue growth | 26.70% |
| operating margins | -10.04% |
| ebitda | -286.03M |
| gross profits | 2.34B |
| free cash flow | 1.01B |
| current ratio | 1.30 |
| return on assets | -6.26% |
| debt to equity | 225.77 |
| return on equity | -113.92% |
| total cash | 1.7B |
| total debt | 1.3B |
| total revenue | 3.18B |
| total cash per share | 6.63 |
| revenue per share | 12.48 |
| quick ratio | 1.25 |
Data Source: RapidAPI Yahoo Finance
Charts: Python generated charts provided courtesy of JustTechMeAt.