Just Tech Me At
Amazon.com, Inc.
Symbol: AMZN
2022
Financial Profile of
Amazon
(March 19, 2023)
Summary
Amazon.com, Inc. engages in the retail sale of consumer products and subscriptions through online and physical stores in North America and internationally. The company operates through three segments: North America, International, and Amazon Web Services (AWS). Its products offered through its stores include merchandise and content purchased for resale; and products offered by third-party sellers The company also manufactures and sells electronic devices, including Kindle, Fire tablets, Fire TVs, Rings, Blink, eero, and Echo; and develops and produces media content. In addition, it offers programs that enable sellers to sell their products in its stores; and programs that allow authors, musicians, filmmakers, Twitch streamers, skill and app developers, and others to publish and sell content. Further, the company provides compute, storage, database, analytics, machine learning, and other services, as well as fulfillment, advertising, and digital content subscriptions. Additionally, it offers Amazon Prime, a membership program. The company serves consumers, sellers, developers, enterprises, content creators, and advertisers. Amazon.com, Inc. was incorporated in 1994 and is headquartered in Seattle, Washington.
Sector: Consumer Cyclical
Industry: Internet Retail
Full-Time Employees: 1541000
Contact
410 Terry Avenue North
Seattle, WA 98109-5210
United States
206 266 1000
website- https://www.amazon.com
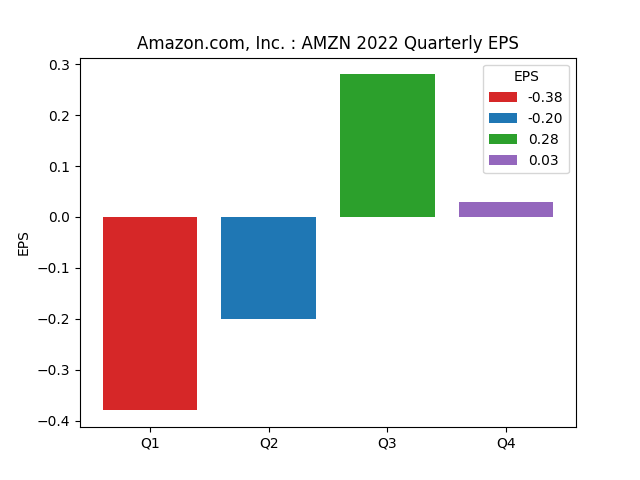
Quarterly
Earning Per Share
| Period | Earnings Per Share |
|---|---|
| 1Q2022 | -0.38 |
| 2Q2022 | -0.20 |
| 3Q2022 | 0.28 |
| 4Q2022 | 0.03 |
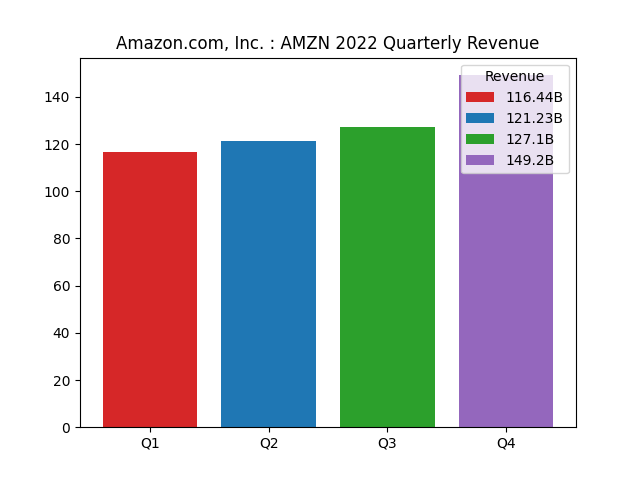
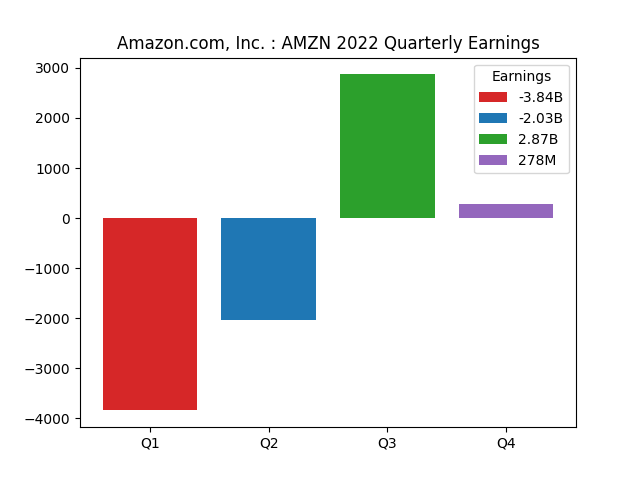
Quarterly
Revenue and Earning
| Period | |||
|---|---|---|---|
| 1Q2022 | |||
| revenue | 116.44B | ||
| earnings | -3.84B | ||
| 2Q2022 | |||
| revenue | 121.23B | ||
| earnings | -2.03B | ||
| 3Q2022 | |||
| revenue | 127.1B | ||
| earnings | 2.87B | ||
| 4Q2022 | |||
| revenue | 149.2B | ||
| earnings | 278M |
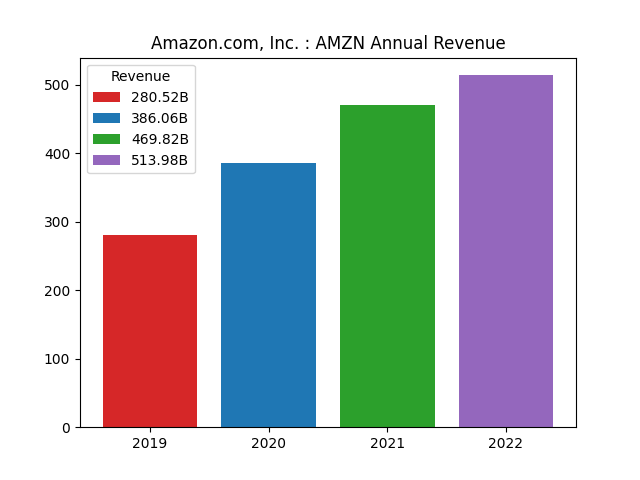
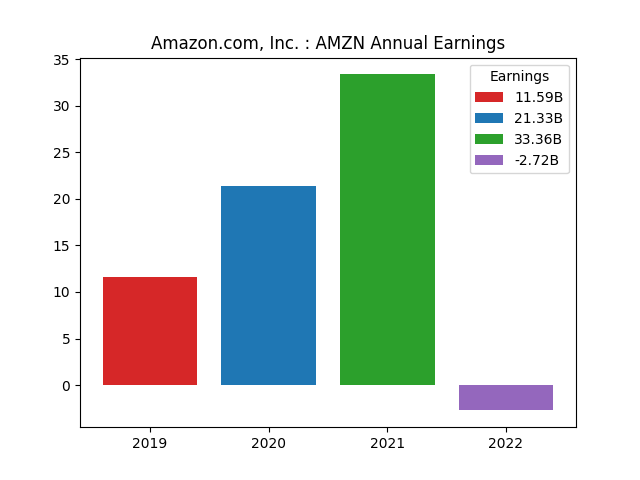
Annual
Revenue and Earning
| Period | |||
|---|---|---|---|
| 2019 | |||
| revenue | 280.52B | ||
| earnings | 11.59B | ||
| 2020 | |||
| revenue | 386.06B | ||
| earnings | 21.33B | ||
| 2021 | |||
| revenue | 469.82B | ||
| earnings | 33.36B | ||
| 2022 | |||
| revenue | 513.98B | ||
| earnings | -2.72B |
Financial Analysis Data
| Assessment | Value |
|---|---|
| ebitda margins | 10.54% |
| profit margins | -0.53% |
| gross margins | 43.81% |
| operating cash flow | 46.75B |
| revenue growth | 8.60% |
| operating margins | 2.38% |
| ebitda | 54.17B |
| gross profits | 225.15B |
| free cash flow | 7.62M |
| earnings growth | -98.60% |
| current ratio | 0.94 |
| return on assets | 1.73% |
| debt to equity | 116.36 |
| return on equity | -1.92% |
| total cash | 70.03B |
| total debt | 169.94B |
| total revenue | 513.98B |
| total cash per share | 6.83 |
| revenue per share | 50.44 |
| quick ratio | 0.72 |
Data Source: RapidAPI Yahoo Finance
Charts: Python generated charts provided courtesy of JustTechMeAt.