Just Tech Me At
Alphabet Inc.
Symbol: GOOG
2022
Financial Profile of
Alphabet
(March 19, 2023)
Summary
Alphabet Inc. offers various products and platforms in the United States, Europe, the Middle East, Africa, the Asia-Pacific, Canada, and Latin America. It operates through Google Services, Google Cloud, and Other Bets segments. The Google Services segment provides products and services, including ads, Android, Chrome, hardware, Gmail, Google Drive, Google Maps, Google Photos, Google Play, Search, and YouTube. It is also involved in the sale of apps and in-app purchases and digital content in the Google Play store; and Fitbit wearable devices, Google Nest home products, Pixel phones, and other devices, as well as in the provision of YouTube non-advertising services. The Google Cloud segment offers infrastructure, cybersecurity, data, analytics, AI, and machine learning, and other services; Google Workspace that include cloud-based collaboration tools for enterprises, such as Gmail, Docs, Drive, Calendar, and Meet; and other services for enterprise customers. The Other Bets segment sells health technology and internet services. The company was founded in 1998 and is headquartered in Mountain View, California.
Sector: Communication Services
Industry: Internet Content & Information
Full-Time Employees: 190234
Contact
1600 Amphitheatre Parkway
Mountain View, CA 94043
United States
650 253 0000
website- https://www.abc.xyz
Quarterly
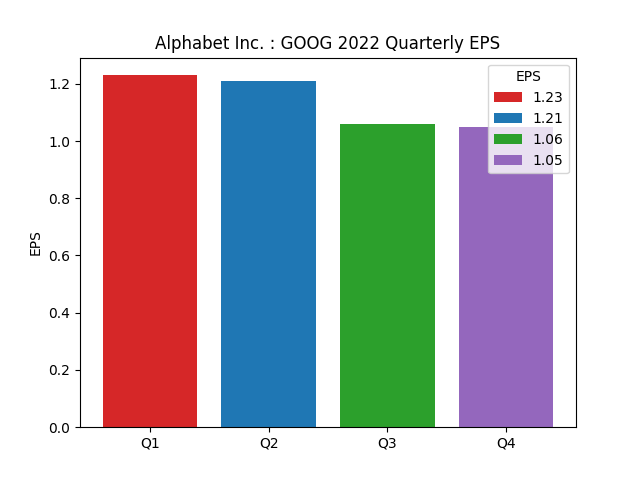
Earning Per Share
| Period | Earnings Per Share |
|---|---|
| 1Q2022 | 1.23 |
| 2Q2022 | 1.21 |
| 3Q2022 | 1.06 |
| 4Q2022 | 1.05 |
Quarterly
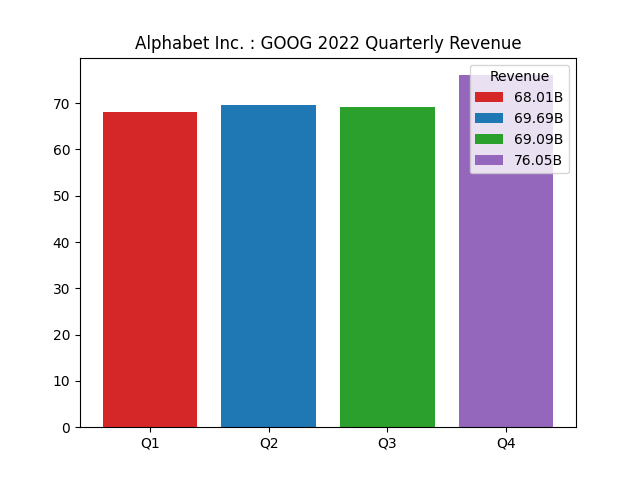
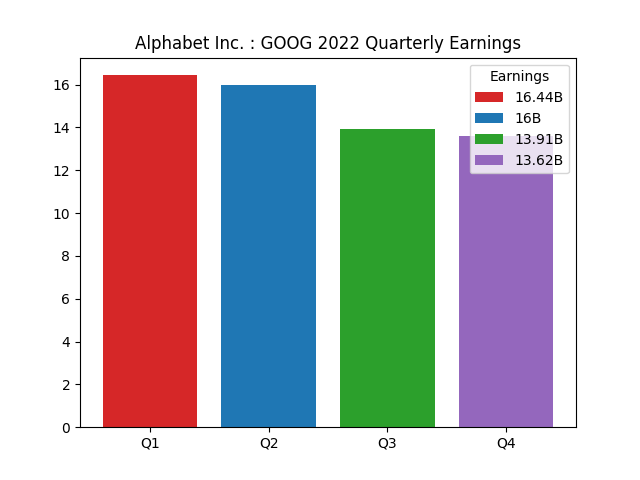
Revenue and Earning
| Period | |||
|---|---|---|---|
| 1Q2022 | |||
| revenue | 68.01B | ||
| earnings | 16.44B | ||
| 2Q2022 | |||
| revenue | 69.69B | ||
| earnings | 16B | ||
| 3Q2022 | |||
| revenue | 69.09B | ||
| earnings | 13.91B | ||
| 4Q2022 | |||
| revenue | 76.05B | ||
| earnings | 13.62B |
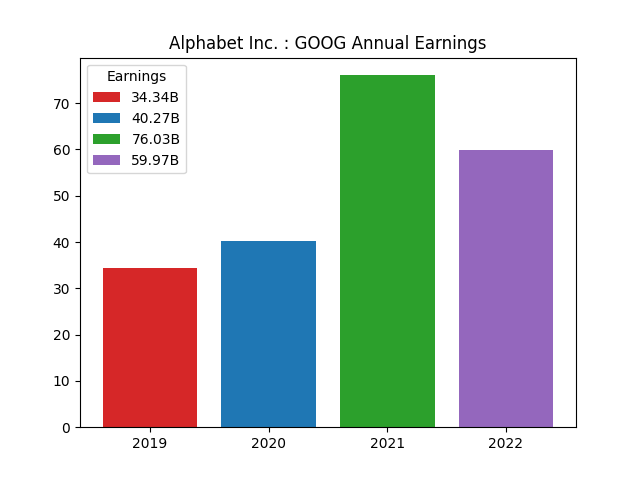
Annual
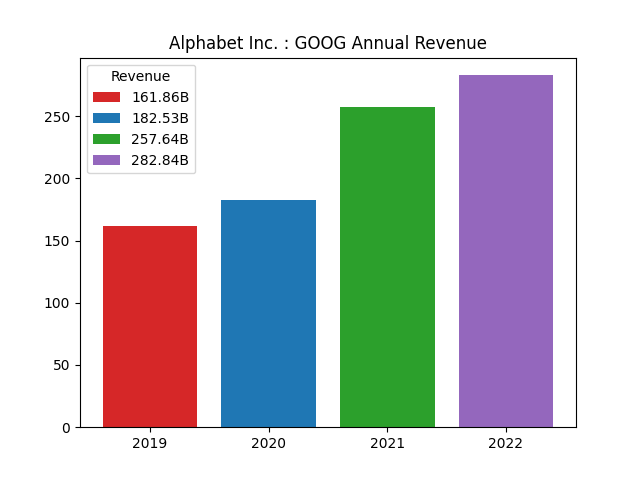
Revenue and Earning
| Period | |||
|---|---|---|---|
| 2019 | |||
| revenue | 161.86B | ||
| earnings | 34.34B | ||
| 2020 | |||
| revenue | 182.53B | ||
| earnings | 40.27B | ||
| 2021 | |||
| revenue | 257.64B | ||
| earnings | 76.03B | ||
| 2022 | |||
| revenue | 282.84B | ||
| earnings | 59.97B |
Financial Analysis Data
| Assessment | Value |
|---|---|
| ebitda margins | 32.09% |
| profit margins | 21.20% |
| gross margins | 55.38% |
| operating cash flow | 91.49B |
| revenue growth | 1.00% |
| operating margins | 26.46% |
| ebitda | 90.77B |
| gross profits | 156.63B |
| free cash flow | 52.53B |
| earnings growth | -31.40% |
| current ratio | 2.38 |
| return on assets | 12.91% |
| debt to equity | 11.70 |
| return on equity | 23.62% |
| total cash | 113.76B |
| total debt | 29.98B |
| total revenue | 282.84B |
| total cash per share | 8.88 |
| revenue per share | 21.65 |
| quick ratio | 2.22 |
Data Source: RapidAPI Yahoo Finance
Charts: Python generated charts provided courtesy of JustTechMeAt.