Just Tech Me At
International Business Machines Corporation
Symbol: IBM
2022
Financial Profile of
International Business Machines
(February 2023)
Summary
International Business Machines Corporation provides integrated solutions and services worldwide. The company operates through four business segments: Software, Consulting, Infrastructure, and Financing. The Software segment offers hybrid cloud platform and software solutions, such as Red Hat, an enterprise open-source solutions; software for business automation, AIOps and management, integration, and application servers; data and artificial intelligence solutions; and security software and services for threat, data, and identity. This segment also provides transaction processing software that supports clients' mission-critical and on-premise workloads in banking, airlines, and retail industries. The Consulting segment offers business transformation services, including strategy, business process design and operations, data and analytics, and system integration services; technology consulting services; and application and cloud platform services. The Infrastructure segment provides on-premises and cloud-based server and storage solutions for its clients' mission-critical and regulated workloads; and support services and solutions for hybrid cloud infrastructure, as well as remanufacturing and remarketing services for used equipment. The Financing segment offers lease, installment payment, loan financing, and short-term working capital financing services. The company was formerly known as Computing-Tabulating-Recording Co. International Business Machines Corporation was incorporated in 1911 and is headquartered in Armonk, New York.
Sector: Technology
Industry: Information Technology Services
Full-Time Employees: NAV
Contact
One New Orchard Road
Armonk, New York 10504
United States
914 499 1900
website- https://www.ibm.com
Quarterly
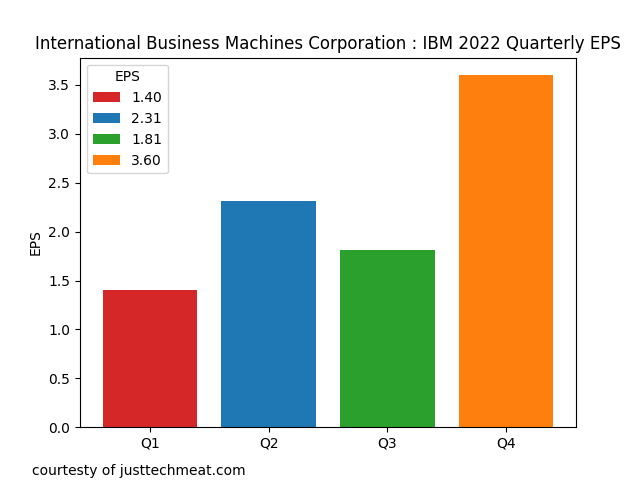
Earning Per Share
| Period | Earnings Per Share |
|---|---|
| 1Q2022 | 1.40 | 2Q2022 | 2.31 | 3Q2022 | 1.81 | 4Q2022 | 3.60 |

Quarterly
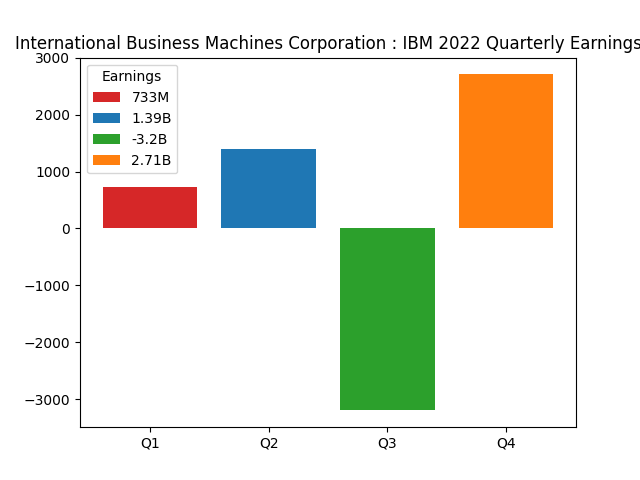
Revenue and Earning
| Period | Qtr Revenue | Qtr Earnings |
|---|---|---|
| 1Q2022 | 14.2B | 733M |
| 2Q2022 | 15.54B | 1.39B |
| 3Q2022 | 14.11B | -3.2B |
| 4Q2022 | 16.69B | 2.71B |


Annual
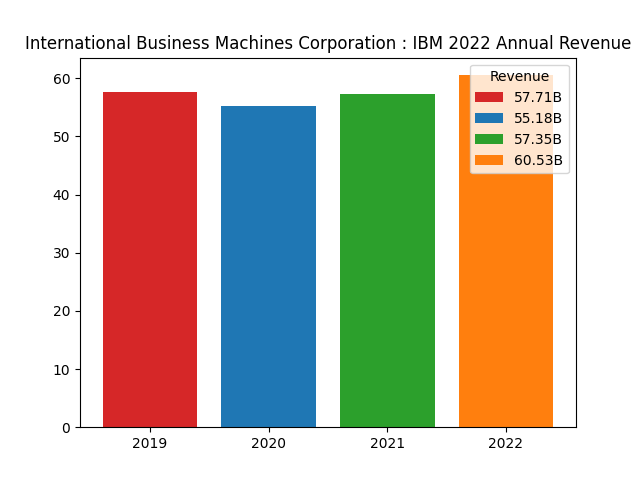
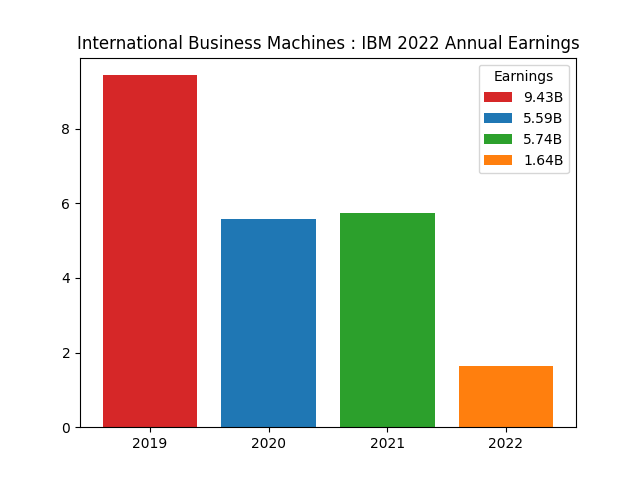
Revenue and Earning
| Period | Annual Revenue | Annual Earnings |
|---|---|---|
| 2019 | 57.71B | 9.43B |
| 2020 | 55.18B | 5.59B |
| 2021 | 57.35B | 5.74B |
| 2022 | 60.53B | 1.64B |


Financial Analysis Data
| Assessment | Value |
|---|---|
| ebitda margin | 20.37% |
| profit margin | 2.71% |
| gross margin | 54.00% |
| operating cash flow | 10.44B |
| revenue growth | 412.30% |
| operating margin | 12.43% |
| ebitda | 12.33B |
| gross profit | 32.69B |
| free cash flow | 9.79B |
| earnings growth | 14.70% |
| current ratio | 0.92 |
| return on asset | 3.63% |
| debt to equity | 245.28 |
| return on equity | 8.69% |
| total cash | 8.74B |
| total debt | 54.01B |
| total revenue | 60.53B |
| total cash per share | 9.65 |
| revenue per share | 67.05 |
| Quick Ratio | 0.76 |
Data Source: RapidAPI Yahoo Finance
Charts: Python generated charts provided courtesy of JustTechMeAt.