Just Tech Me At
Intel Corporation
Symbol: INTC
2022
Financial Profile of
Intel Corporation
(March 14, 2023)
Summary
Intel Corporation designs, develops, manufactures, markets, and sells computing and related products worldwide. It operates through Client Computing Group, Data Center and AI, Network and Edge, Mobileye, Accelerated Computing Systems and Graphics, Intel Foundry Services, and Other segments. The company offers platform products, such as central processing units and chipsets, and system-on-chip and multichip packages; and accelerators, boards and systems, connectivity products, and memory and storage products. It also provides high-performance compute solutions for targeted verticals and embedded applications for retail, industrial, and healthcare markets; and solutions for assisted and autonomous driving comprising compute platforms, computer vision and machine learning-based sensing, mapping and localization, driving policy, and active sensors. In addition, the company offers workload-optimized platforms and related products for cloud service providers, enterprise and government, and communications service providers. It serves original equipment manufacturers, original design manufacturers, cloud service providers, and other equipment manufacturers. The company was incorporated in 1968 and is headquartered in Santa Clara, California.
Sector: Technology
Industry: Semiconductors
Full-Time Employees: 131900
Contact
2200 Mission College Boulevard
Santa Clara, CA 95054-1549
United States
408 765 8080
website- https://www.intel.com
Quarterly
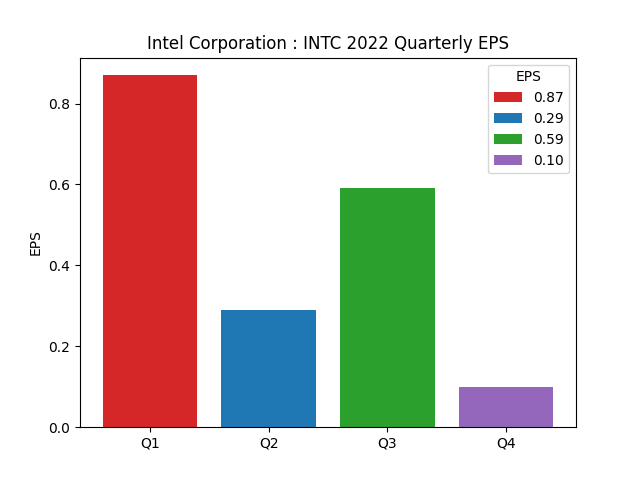
Earning Per Share
| Period | Earnings Per Share |
|---|---|
| 1Q2022 | 0.87 |
| 2Q2022 | 0.29 |
| 3Q2022 | 0.59 |
| 4Q2022 | 0.10 |

Quarterly
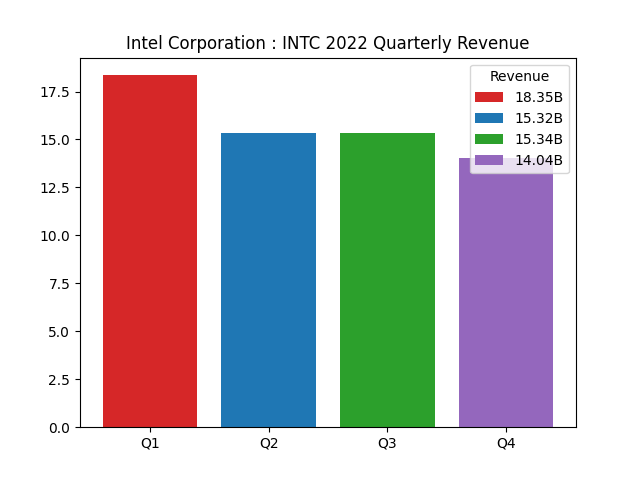
Revenue and Earning
| Period | |||
|---|---|---|---|
| 2Q2022 | |||
| revenue | 18.35B | ||
| earnings | 8.11B | ||
| 3Q2022 | |||
| revenue | 15.32B | ||
| earnings | -454M | ||
| 4Q2022 | |||
| revenue | 15.34B | ||
| earnings | 1.02B | ||
| 4Q2022 | |||
| revenue | 14.04B | ||
| earnings | -664M |


Annual
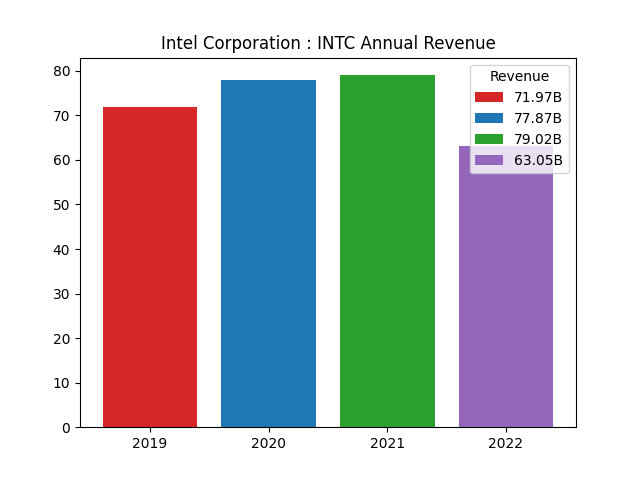
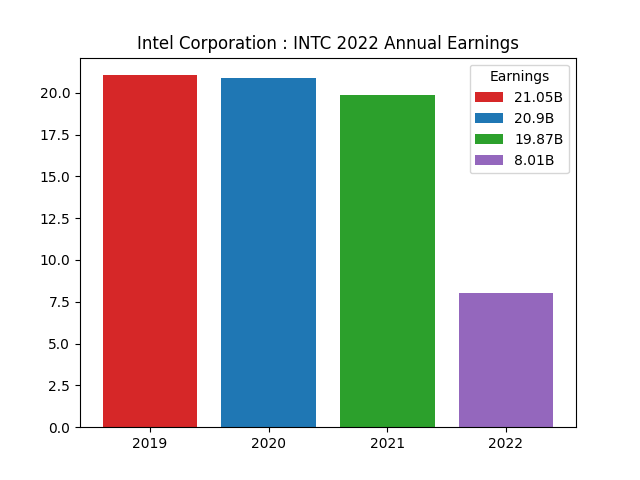
Revenue and Earning
| Period | |||
|---|---|---|---|
| 2019 | |||
| revenue | 71.97B | ||
| earnings | 21.05B | ||
| 2020 | |||
| revenue | 77.87B | ||
| earnings | 20.9B | ||
| 2021 | |||
| revenue | 79.02B | ||
| earnings | 19.87B | ||
| 2022 | |||
| revenue | 63.05B | ||
| earnings | 8.01B |


Financial Analysis Data
| Assessment | Value |
|---|---|
| ebitda margins | 24.38% |
| profit margins | 12.71% |
| gross margins | 42.61% |
| operating cash flow | 15.43B |
| revenue growth | -31.60% |
| operating margins | 3.70% |
| ebitda | 15.37B |
| gross profits | 26.87B |
| free cash flow | 4.3B |
| current ratio | 1.57 |
| return on assets | 0.83% |
| debt to equity | 41.12 |
| return on equity | 8.07% |
| total cash | 28.34B |
| total debt | 42.47B |
| total revenue | 63.05B |
| total cash per share | 6.85 |
| revenue per share | 15.35 |
| quick ratio | 1.01 |
Data Source: RapidAPI Yahoo Finance
Charts: Python generated charts provided courtesy of JustTechMeAt.