Just Tech Me At
Mastercard Incorporated
Symbol: MA
2022
Financial Profile of
Mastercard Incorporated
(February 2023)
Summary
Mastercard Incorporated, a technology company, provides transaction processing and other payment-related products and services in the United States and internationally. It facilitates the processing of payment transactions, including authorization, clearing, and settlement, as well as delivers other payment-related products and services. The company offers integrated products and value-added services for account holders, merchants, financial institutions, businesses, governments, and other organizations, such as programs that enable issuers to provide consumers with credits to defer payments; payment products and solutions that allow its customers to access funds in deposit and other accounts; prepaid programs services; and commercial credit, debit, and prepaid payment products and solutions. It also provides value-added products and services comprising cyber and intelligence solutions for parties to transact, as well as proprietary insights, drawing on principled use of consumer, and merchant data services. In addition, the company offers analytics, test and learn, consulting, managed services, loyalty, processing, and payment gateway solutions for e-commerce merchants. Further, it provides open banking and digital identity platforms services. The company offers payment solutions and services under the MasterCard, Maestro, and Cirrus. Mastercard Incorporated was founded in 1966 and is headquartered in Purchase, New York.
Sector: Financial Services
Industry: Credit Services
Full-Time Employees: 29900
Contact
2000 Purchase Street
Purchase, New York 10577
United States
914 249 2000
website- https://www.mastercard.com
Quarterly
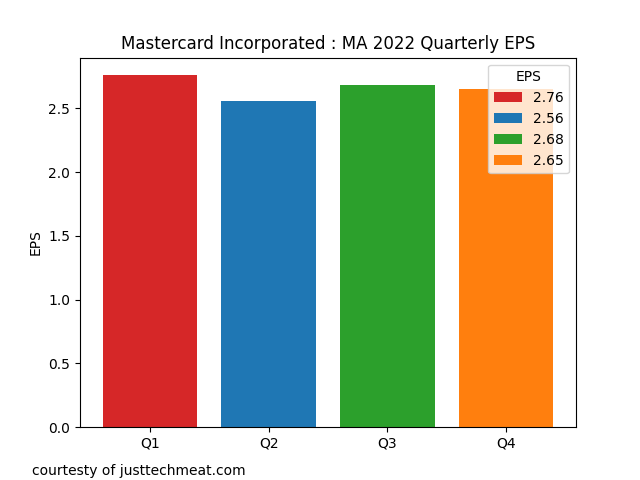
Earning Per Share
| Period | Earnings Per Share |
|---|---|
| 1Q2022 | 2.76 | 2Q2022 | 2.56 | 3Q2022 | 2.68 | 4Q2022 | 2.65 |
Quarterly
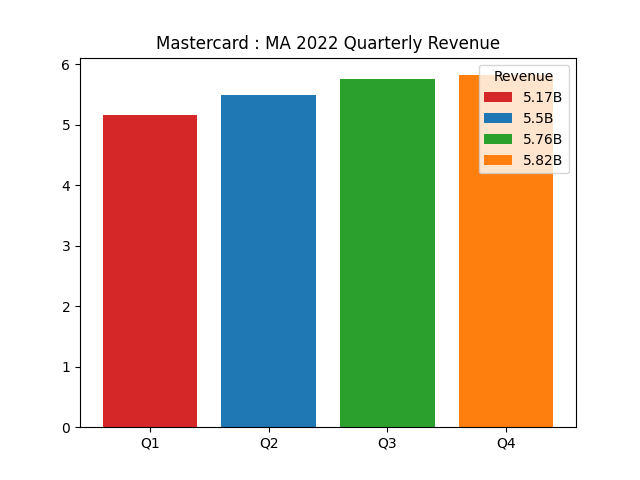
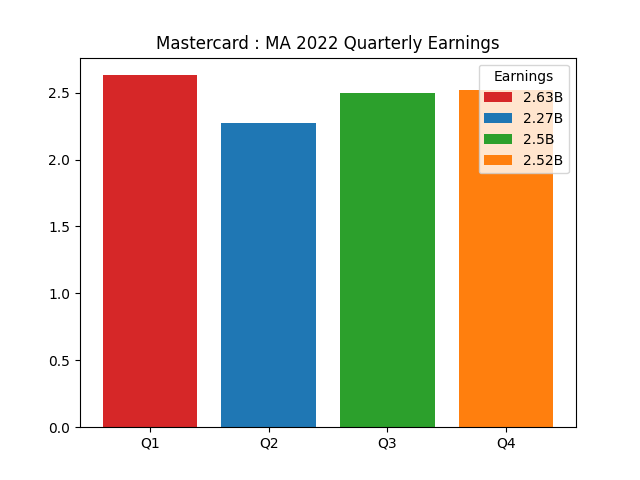
Revenue and Earning
| Period | Qtr Revenue | Qtr Earnings |
|---|---|---|
| 1Q2022 | 5.17B | 2.63B |
| 2Q2022 | 5.5B | 2.27B |
| 3Q2022 | 5.76B | 2.5B |
| 4Q2022 | 5.82B | 2.52B |
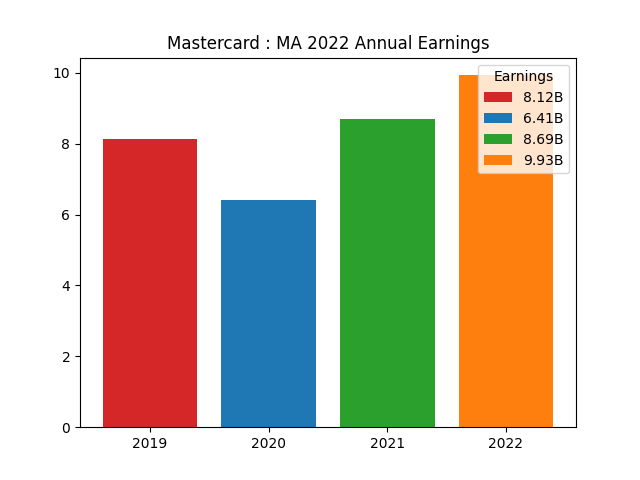
Annual
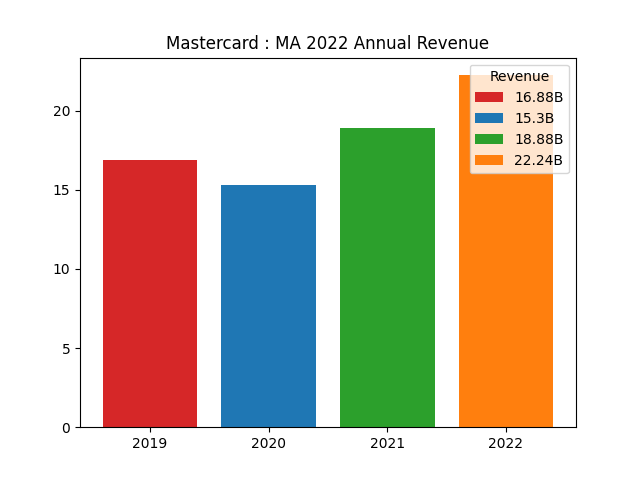
Revenue and Earning
| Period | Annual Revenue | Annual Earnings |
|---|---|---|
| 2019 | 16.88B | 8.12B |
| 2020 | 15.3B | 6.41B |
| 2021 | 18.88B | 8.69B |
| 2022 | 22.24B | 9.93B |
Financial Analysis Data
| Assessment | Value |
|---|---|
| ebitda margin | 60.76% |
| profit margin | 44.65% |
| gross margin | 100.00% |
| operating cash flow | 11.19B |
| revenue growth | 11.50% |
| operating margin | 56.77% |
| ebitda | 13.51B |
| gross profit | 22.24B |
| free cash flow | 10.64B |
| earnings growth | 8.60% |
| current ratio | 1.17 |
| return on asset | 20.66% |
| debt to equity | 231.97 |
| return on equity | 144.03% |
| total cash | 7.41B |
| total debt | 14.79B |
| total revenue | 22.24B |
| total cash per share | 7.77 |
| revenue per share | 22.97 |
| Quick Ratio | 0.76 |
Data Source: RapidAPI Yahoo Finance
Charts: Python generated charts provided courtesy of JustTechMeAt.