Just Tech Me At
Meta Platforms, Inc.
Symbol: META
2022
Financial Profile of
Meta
(March 19, 2023)
Summary
Meta Platforms, Inc. engages in the development of products that enable people to connect and share with friends and family through mobile devices, personal computers, virtual reality headsets, and wearables worldwide. It operates in two segments, Family of Apps and Reality Labs. The Family of Apps segment offers Facebook, which enables people to share, discuss, discover, and connect with interests; Instagram, a community for sharing photos, videos, and private messages, as well as feed, stories, reels, video, live, and shops; Messenger, a messaging application for people to connect with friends, family, communities, and businesses across platforms and devices through text, audio, and video calls; and WhatsApp, a messaging application that is used by people and businesses to communicate and transact privately. The Reality Labs segment provides augmented and virtual reality related products comprising consumer hardware, software, and content that help people feel connected, anytime, and anywhere. The company was formerly known as Facebook, Inc. and changed its name to Meta Platforms, Inc. in October 2021. Meta Platforms, Inc. was incorporated in 2004 and is headquartered in Menlo Park, California.
Sector: Communication Services
Industry: Internet Content & Information
Full-Time Employees: 86482
Contact
1601 Willow Road
Menlo Park, CA 94025
United States
650 543 4800
website- https://investor.fb.com
Quarterly
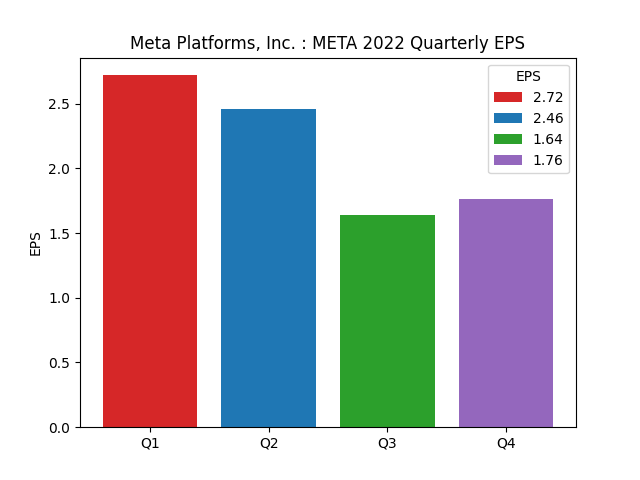
Earning Per Share
| Period | Earnings Per Share |
|---|---|
| 1Q2022 | 2.72 |
| 2Q2022 | 2.46 |
| 3Q2022 | 1.64 |
| 4Q2022 | 1.76 |
Quarterly
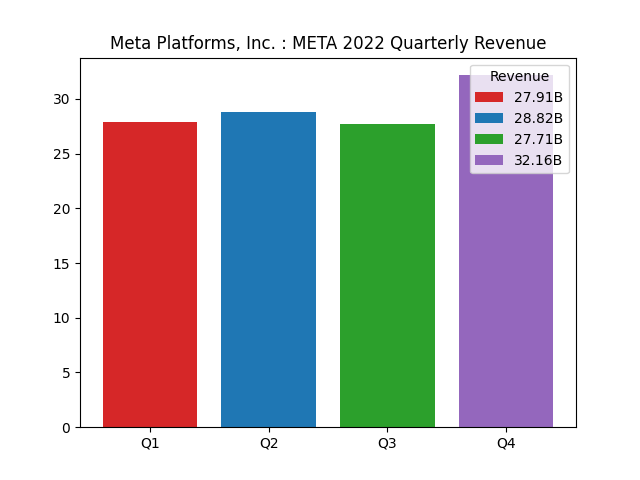
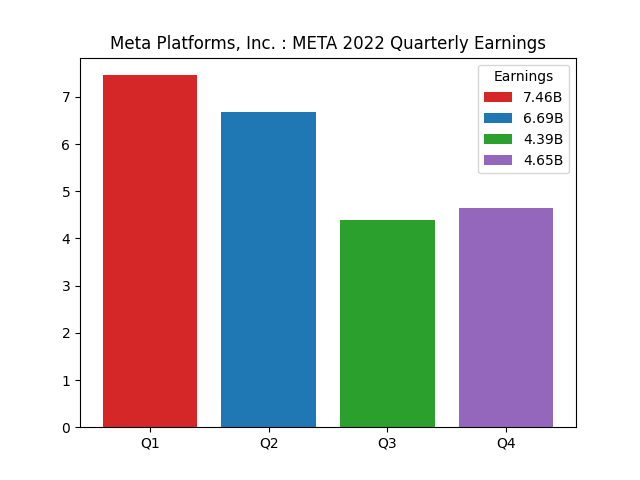
Revenue and Earning
| Period | |||
|---|---|---|---|
| 1Q2022 | |||
| revenue | 27.91B | ||
| earnings | 7.46B | ||
| 2Q2022 | |||
| revenue | 28.82B | ||
| earnings | 6.69B | ||
| 3Q2022 | |||
| revenue | 27.71B | ||
| earnings | 4.39B | ||
| 4Q2022 | |||
| revenue | 32.16B | ||
| earnings | 4.65B |
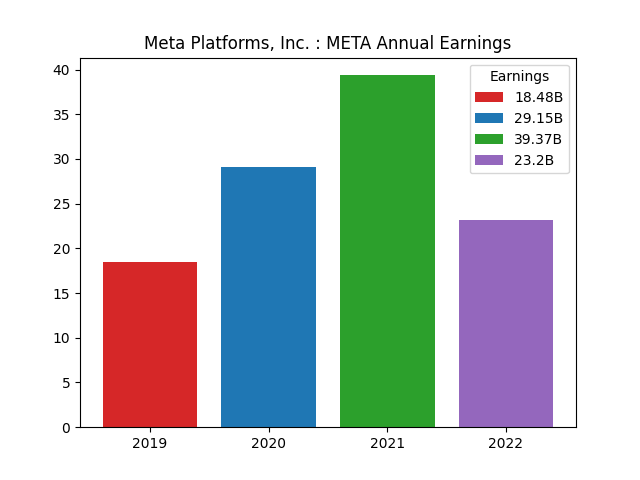
Annual
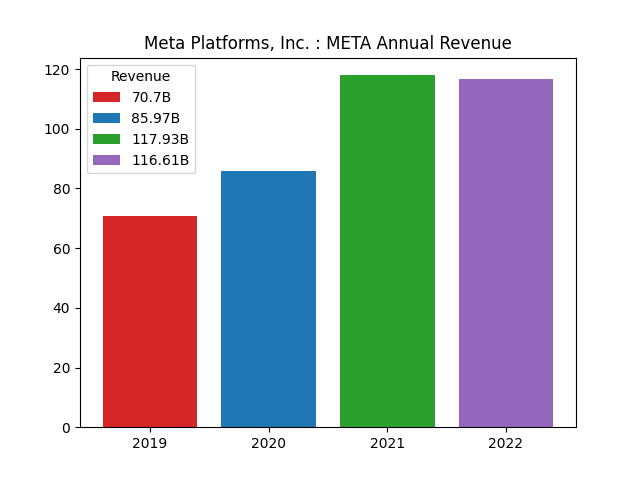
Revenue and Earning
| Period | |||
|---|---|---|---|
| 2019 | |||
| revenue | 70.7B | ||
| earnings | 18.48B | ||
| 2020 | |||
| revenue | 85.97B | ||
| earnings | 29.15B | ||
| 2021 | |||
| revenue | 117.93B | ||
| earnings | 39.37B | ||
| 2022 | |||
| revenue | 116.61B | ||
| earnings | 23.2B |
Financial Analysis Data
| Assessment | Value |
|---|---|
| ebitda margins | 36.22% |
| profit margins | 19.90% |
| gross margins | 79.63% |
| operating cash flow | 50.47B |
| revenue growth | -4.50% |
| operating margins | 28.78% |
| ebitda | 42.24B |
| gross profits | 92.86B |
| free cash flow | 15.6B |
| earnings growth | -52.00% |
| current ratio | 2.20 |
| return on assets | 11.92% |
| debt to equity | 21.70 |
| return on equity | 18.52% |
| total cash | 40.74B |
| total debt | 27.28B |
| total revenue | 116.61B |
| total cash per share | 15.71 |
| revenue per share | 43.40 |
| quick ratio | 2.01 |
Data Source: RapidAPI Yahoo Finance
Charts: Python generated charts provided courtesy of JustTechMeAt.